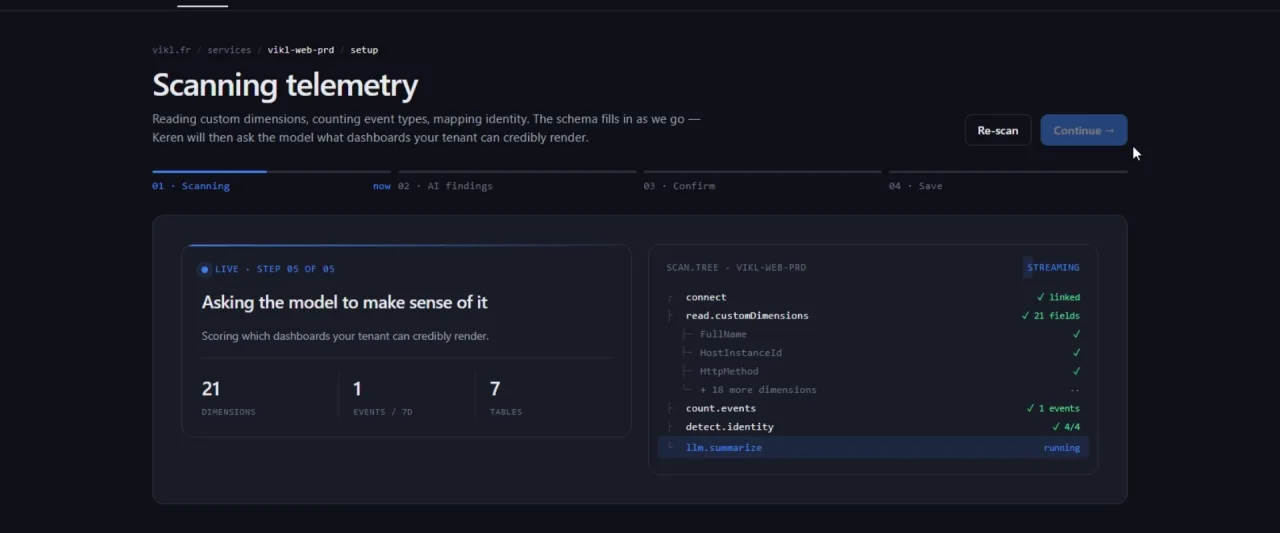
The Azure dashboard
you wish the portal was.
Marketing & Technical dashboards on top of Application Insights — in 2 minutes, with no agent, no data leaving your tenant, and a readiness score that tells you what to fix next.
From sign-in to first dashboard
KQL templates, server-rendered
of raw telemetry ever stored
max readiness score, deterministically scored
One connection. Two audiences. Zero KQL to write.
Behavioral analytics, without the SDK ceremony.
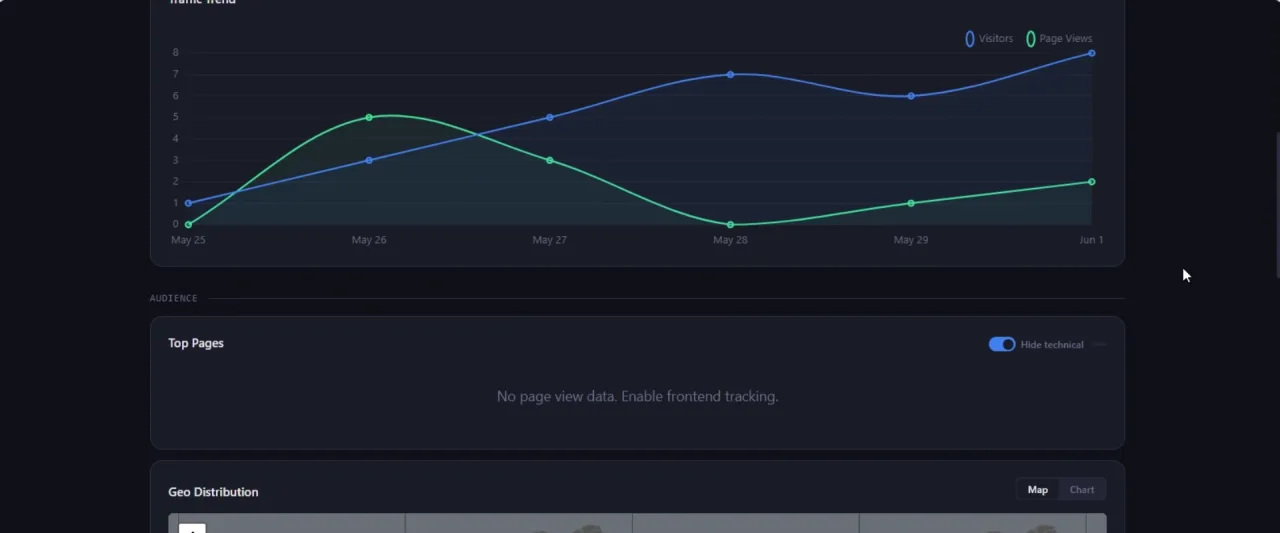
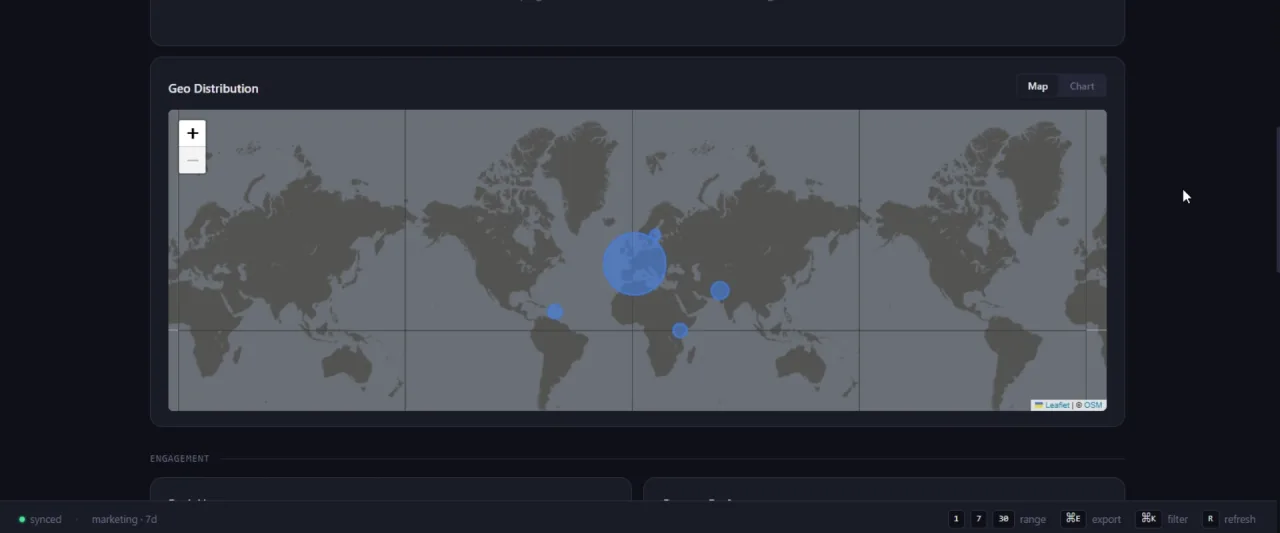
Visitors, sessions, geo, navigation paths, UTM campaigns, peak hours. Period-over-period deltas on every KPI. A Sankey of your real user flow, built from the events you're already collecting.
Latency & errors, percentile-honest.
p50/p95/p99 on every endpoint. Frontend Real-User Monitoring split into network, send, receive, processing. Reconstructed session timelines — no screen recording, just the events you already have.
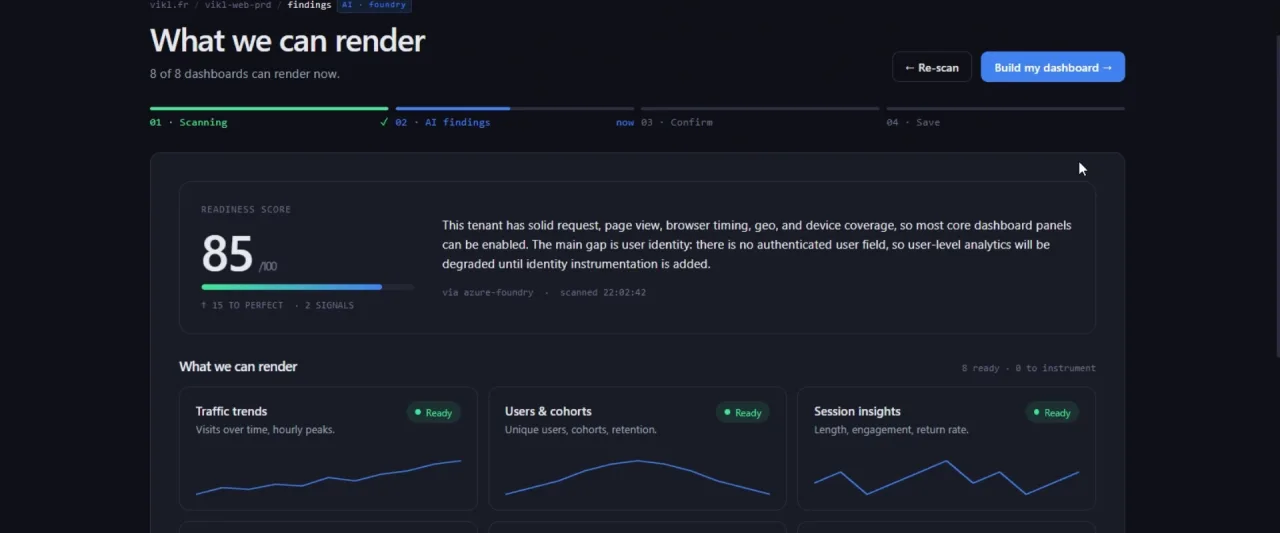
A score, and the prompt to fix it.
Seven signals, scored 0–100, weighted by what actually drives dashboard value. Each gap comes with a copy-paste prompt you can drop into Cursor or Copilot that generates the exact instrumentation code.
Honest about the trade-offs.
| Keren | Azure Portal | Datadog | Power BI | |
|---|---|---|---|---|
| Time to first dashboard | ~2 min (Docker) | 30+ min (write KQL) | 1–2h (agent + setup) | Hours (data prep) |
| Marketing / Technical split | Built-in | Manual workbook | Add-on | Manual report |
| Readiness + AI prompts | 0–100, LLM-ready | — | Limited | — |
| Schema auto-mapping | Alias + regex (LLM opt-in) | Manual | Manual | Manual |
| Data residency | Stays in tenant | Native | New endpoint | New endpoint |
| License / cost | MIT, free | Included w/ Azure | Per-host $$$ | Per-user $$ |
Launch-time positions; the gaps narrow as each tool evolves. The columns we're least kind to are the most mature and have features we don't.
Your data never leaves your tenant.
Only aggregated metrics and setup metadata cross the wire. The promise is enforced as automated checks that run on every push, every PR, and a Monday cron.
Any new fs.write in src/ fails CI
No inline scripts, no eval
httpOnly · secure · sameSite
Delegated tokens, no client secret
Lint + audit pass
Blocks merge
Common questions.
Does it store my telemetry data?+
No raw rows. Only aggregated metrics and setup metadata (mapping, dashboard payload). Two filesystem sinks on the server, both documented in SECURITY.md; any other fs.write in src/ fails the security audit.
How does it connect to Azure?+
OAuth (PKCE) against Entra ID. You sign in once, the service exchanges the code for a delegated token, and queries run with your permissions — Reader on the subscription, Log Analytics Reader on the workspace.
Do I need to register my own Azure app?+
No. The host of the Keren instance you're using did that once. You click Connect, sign in with your normal Microsoft account — same flow as Slack, Loom, Notion.
Is the AI part required?+
No. Launch ships with deterministic schema mapping (alias + regex covering ~80% of real-world naming) and a deterministic Environment Analysis panel. Real Azure OpenAI is opt-in, post-launch.
Can my coding agent instrument it for me?+
Yes. We publish a public telemetry contract — which signals to emit, how to name custom dimensions, config best practices — that Cursor, Copilot or Claude Code can read so a new app renders the full dashboard from its first scan, no manual mapping. Machine-readable at /.well-known/telemetry-contract.json.
See yours in two minutes.
The demo runs on real sample data. Connect when you're ready — no signup, no card.
Application Insights dashboard — visitors, performance, and readiness for the selected range.
Traffic Trend
Top Pages
| Path | Views | Share |
|---|
Geo Distribution
Peak Hours
Content Performance
Campaigns & URL Parameters
| Source | Medium | Campaign | Visitors | Sessions |
|---|
Auto-detected URL parameters from your telemetry. Pin any parameter to add it as a dashboard filter.
Conversion Funnel
Traffic Sources
User Flow
| From | To | Transitions |
|---|
Browser
OS
Device
Frontend Performance
Slow Endpoints
| Path | P50 | P95 | P99 | Calls | Err% |
|---|
Session Timelines
Reconstructed user journeys from telemetry events. No screen recording needed.
Slow Dependencies
Outbound calls (DB, HTTP, queues, cache) ranked by p95 latency.
| Target | Type | P50 | P95 | Calls | Fail% |
|---|
Dependency Types
Top Exceptions
Server-side errors by type. Messages and stack traces stay on your side — only types and counts are shown.
| Type | Count | Ops | Users |
|---|
Response Status Codes
Service Health
Request volume, latency and error rate per service (cloud_RoleName).
| Service | Requests | Avg | P95 | Err% |
|---|
Signal Breakdown
Click How to fix on any missing signal to get a ready-to-use prompt for your AI code assistant.